The following piece was published as a guest editorial on the environment in the November 28th Beachcomber issue. It discusses the subtlety of environmental change and why the Vashon Maury Island Groundwater Protection Committee’s newly released environmental report card is helpful in detecting hard to see changes in our water resources.
We flipped over a rock on the beach. Nothing.What about this one? Nope. Would we find one under this? Finally, a tiny green crab! We looked at him for a bit marveling at his little pincers flailing helplessly in the air. Then: “Mama! Let’s look for beach glass!” And we were off.
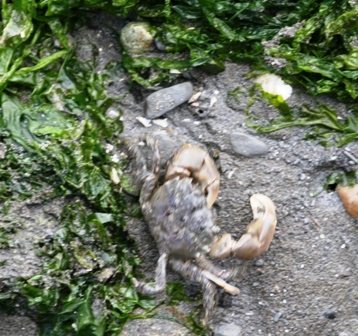
Photo below is from Vashon Nature Center LLC’s Neill Point Bioblitz. photo credit: Ed Otto
But I couldn’t shake what I had seen, or rather what I had NOT seen. Was I remembering wrong? As a child there were multitudes of crabs here- crabs as small as my pinky, as big as my daughter’s little palms, green crabs, purple crabs, reddish crabs, crabs with one pincer bigger than the other, orange crabs, fierce crabs, gentle crabs, fast running crabs. We made sand castles for them, racetracks, and obstacle courses. But on this particular day- one little green crab-that was it?
It bothered me that seeing only one crab seemed normal to my children. It unsettled me that this was the baseline against which they would judge change on this beach. Then it occurred to me–my baseline was different than those before me.
Older islanders talk of hauling wheelbarrows of salmon carcasses to their gardens for fertilizer and of sea lions lounging at Judd Creek’s mouth feasting on multitudes fish slithering homeward. They talk of spring runs and fall runs of salmon in our creeks. And I was encouraged to see 4 salmon in the creeks last fall. From generation to generation the baseline upon which we measure change on Vashon slowly shifts with us, reset with each new childhood or with each new move to island shores. Because we measure change from when we start in a place, in our extremely mobile society, incremental degradation of nature goes largely unnoticed and unabated overtime.
Peter Kahn, professor of environmental psychology at University of Washington, has a name for this phenomenon of shifting baselines. He calls it environmental generational amnesia. And it’s dangerous because it keeps us from noticing change until it can’t be ignored (i.e. super storms, dead zones in the ocean, eutrophication of harbors and lakes). At a certain point it is much harder to turn the Titanic around.
Some change is unavoidable and not all change is “bad”. However, there are changes directly linked to our island’s overall ecological health and to the sustainability of our own human community that we would be wise to pay attention to.
This is why the Groundwater Protection Committee’s (GWPC) environmental report card is such an important community resource. It reveals otherwise hard to see environmental changes. Report card indicators track signals in our island environment that directly relate to our sustainability, most specifically, the sustainability of our water resources—drinking water, streams, and underground stores.
Just as a doctor checks vital signs to monitor changes in health, sustainability indicators take the pulse of our island home. They are not perfect and they will likely be fine-tuned overtime but they are a valiant start and they give us useful information that we can learn from to make smart decisions concerning island waters.
If you have perused the report card in the November 14th issue of the Beachcomber you will see we aren’t doing too poorly. Many of our water quality indicators are in the green. We have water that is still fit for human consumption and the supply isn’t dwindling. As an ecologist however, I take notice of the biological indicators–salmon populations, and aquatic invertebrates. By looking at water quality indicators we get the impression that our streams are doing well. Then, why are biological indicators in the red?
This is partly a sensitivity issue. Water quality indicators are calibrated to safe human consumption levels whereas biological indicators, like invertebrates, respond to changes in the integrity of the stream environment as a whole. They are our warrior species, living on the front lines of change and fighting for their lives before anyone else does. If they lose the fight, the sweep of change eventually snowballs closer to us.
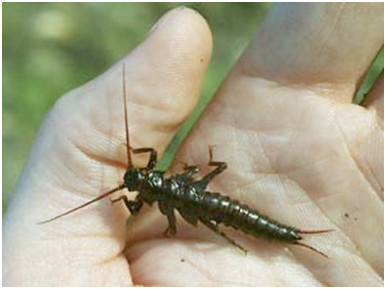
Stonefly larvae. photo credit: Jeff Adams, Xerces Society
For example, invertebrates in streams are food for fish and birds. They also help keep streams clean by decomposing plant and animal matter and cycling nutrients out of water and substrates and back to plants and animals.
What is causing low levels of invertebrates in our streams? It’s a mystery. Invertebrates are canaries in the coal mine for streams. Some are sensitive to increased sediment loads due to erosion. Some decline when excess nitrogen, phosphorous, heavy metals or other pollutants enter the stream system. When invertebrate diversity declines across the board, a combination of different impacts may be starting to overwhelm streams.
Existing data on island invertebrates points to some possible reasons for our low scoring streams and also reveals potential successes, like small stretches of Judd Creek that may have improved over the past 7 years. Help GWPC look further into these mysteries by sampling invertebrates in island streams next fall (want to help or have any questions? Email: info@vashonnaturecenter.org).
The GWPC’s report card is a locally created and important resource that our community can use as an early warning system that identifies impacts to water resources before they escalate beyond control. But, the changes tracked matter for other reasons as well. On the periphery of these measurements lurks the tug on your hook in Quartermaster Harbor. Folded into these numbers is that flash of red or silver rocketing itself upstream. Just behind those pie charts flits the bright wing of a migratory bird. The health of our water is tied to a vibrant network of life that enriches us in a multitude of ways.